


INTRODUCTION
Wheelchair basketball is one of the most popular sports in the Paralympic movement and has been included in every edition of the Paralympic Games since 19601. The sport requires the athlete to perform complex tasks such as wheelchair propulsion, braking, and spinning, while simultaneously executing sport-specific skills like dribbling, passing, catching, and shooting, often at high speeds and under physical contact2. The game follows the same rules and court dimensions as Olympic basketball3. The ability of athletes to perform these skills is linked to their trunk functionality4,5, which varies according to the level of physical and motor impairment.
In basketball, the athletes are allocated into one of eight sports classes (from 1.0 to 4.5) based on their functional capacity on the court6. This classification is primarily observational, relying on visual assessment of the athlete’s movement capabilities. However, this method has been widely criticized for its subjectivity and potential inconsistencies7. In response, the International Paralympic Committee (IPC) has encouraged the development of evidence-based classification systems that incorporate objective and quantifiable data8. In this context, technological solutions such as wearable sensors have emerged as promising tools to support a more accurate and fairer classification process.
Inertial measurement units (IMUs), comprising accelerometers, gyroscopes, and sometimes magnetometers, have gained attention for their ability to objectively measure body movements in both clinical and sports settings9. These devices have demonstrated good validity and reliability when compared to traditional motion capture systems, with errors below 5º and high intraclass correlation coefficients (ICCs)10,11. IMUs can be positioned on different parts of the body, making them suitable for various protocols. They can be used to capture detailed kinematic data during functional tasks or sport-specific movements, enabling performance monitoring and movement analysis in real-world environments such as the basketball court.
In wheelchair basketball, a few studies have explored the use of IMUs to support the process of classification. These studies used three IMUs positioned on the wheelchair (one on each rear wheel axis and another on the rear frame bar), and analyzed variables like acceleration and velocity in relation to athlete sport class7,12,13. Although these studies provide initial evidence that mobility metrics may correlate with classification in wheelchair basketball, their sensor positioning was limited exclusively to the wheelchair frame: none have explored the positioning of the sensors on the trunk of the athlete, despite trunk position being a key factor in classification in wheelchair basketball.
Considering the importance of trunk functionality in class allocation, it is reasonable to hypothesize that positioning sensors on the trunk could provide relevant data for assessing functional movement more directly. By capturing motion patterns in the trunk across three axes, such an approach could improve the objectivity and specificity of classification. Furthermore, trunk-mounted sensors may also offer practical benefits for coaches, helping to inform training strategies and provide performance feedback based on real-time biomechanics14.
Despite the potential of IMUs, the evidence on their optimal positioning remains scarce, especially data regarding the sensor positions on the body, rather than on the wheelchair. To fill this gap, the present study aims to identify an optimal scheme for sensor positioning on both the athlete and the wheelchair, to improve the accuracy and applicability of objective measures in the final stage of the classification process, especially those related to trunk functionality.
MATERIALS AND METHODS
Study design and participant characterization
This study is characterized as a cross-sectional observational analytical study. It included ten wheelchair basketball athletes (male = eight, female = two; mean ± standard deviation: 36.6 ± 9.1 years; G*power = 0.19) participating in first and second-division wheelchair basketball in Brazil. The research participants were selected through convenience sampling. Participation in the research was voluntary; the athletes were recruited from two teams in the same city where the study was conducted. The description of the participants can be found in Table 1. Informed consent was obtained from all individuals involved in the study. This study was approved by the research ethics committee of the Institute of Health Sciences of the Federal University of Pará (Code: 32019420.0.0000.0018).
Protocol
Inertial measurement units (IMUs) were positioned on the back of the wheelchair backrest, between vertebrae T1 and T2, and on the right wrist. The wheelchair was chosen for placement because it was successfully used in previous studies7,12,13. The trunk and wrist locations were chosen due to their role in the sport classification process. Two field tests were performed: 20-meter speed test and an Illinois agility test. During the tests, the athletes were instructed to use the straps they usually wear to play wheelchair basketball. Due to the commute to the data collection site, the athletes propelled their wheelchairs for approximately 7 minutes before performing the tests. Thus, no additional warm-ups were carried out prior to the field tests. Between 20-meter speed test and an Illinois agility test, a 10-minute rest period was given for recovery.
20-meter speed test
The participant starts from a stationary position behind the starting line and, after a verbal command, propels the wheelchair as quickly as possible for a straight distance of 20 meters. The test was performed twice with one minute of rest between each attempt15. The best result was considered for analysis.
This test has demonstrated excellent test-retest reliability in wheelchair basketball and other wheelchair sports, with intraclass correlation coefficients (ICC) above 0.90, confirming its consistency in assessing sprint performance16.
Illinois agility test
The athlete completes a predetermined circuit that includes straight and zigzag movements. The test itself consists of three sets of two 10m shuttles around cones, including a slalom, with the finish point five meters from the starting point. After the start command, the athlete must complete the course in the shortest time possible. Each participant performed two attempts with a one-minute interval between them17. The best result was considered for analysis.
The Illinois agility test has shown good to excellent reliability in wheelchair sports settings, with reported ICC values ranging from 0.85 to 0.95 in previous studies involving wheelchair basketball athletes18.
Inertial measurement unit
MetaMotionC – MMC (MetaMotionCTM, MBIENTLAB-INC) sensors were used as IMUs. These sensors contain a tri-axial accelerometer that records linear acceleration values and a gyroscope that collects angular velocity measurements in three axes of motion: X, Y, and Z. The sensors were calibrated according to the manufacturer’s specifications with a sampling frequency of 100 Hz and a sensitivity of 16 g for the accelerometer and 2000°/s for the gyroscope. The reliability of the sensor was previously tested in a study evaluating its use for postural adjustment assessments during predictable perturbations in sports; all tested variables demonstrated a significant linear correlation between the sensor and the gold standard camera system, with a moderate to large coefficient of r ≥ 0.5, as well as excellent reliability (0.75)19. The data from the IMU were collected using the manufacturer’s application, and the raw data were exported to an Excel spreadsheet.
Data analysis
After data collection, the raw linear acceleration and angular velocity data were exported through a document in CSV format to R software. This signal was then filtered through a fourth-order Butterworth filter with a cut-off frequency of 5 Hz for the 20-meter speed test and 15 Hz for the Illinois agility test.
After signal smoothing, 64 variables were extracted: eight time-domain parameters from each axis (X, Y, Z) and the resultant signal of both the accelerometer and gyroscope. These parameters have frequently been included in IMU-based human movement analysis to characterize signal variability, magnitude and distribution20,21. Table 2 provides a detailed description of each parameter, including its mathematical definition, the physical aspect it represents, and the corresponding R function used for computation.
Table 2
Parameters extracted from the accelerometer and gyroscope signal
Statistical Analysis
Descriptive statistics (mean and standard deviation) were performed for epidemiological data, and the time taken to perform the skill tests. The Shapiro-Wilk test was used to assess the normality of the data; if normality was not found, the data was subjected to logarithmic transformation. The correlation between all IMU data and functional class was evaluated based on Pearson’s R. The p-value adopted was p < 0.05. All extraction calculations and analyses were performed using R Studio software (RStudio Team, version 4.0.2).
RESULTS
While the lower-class athletes needed more time to complete the 20-meter speed test and the Illinois agility test than the higher-class group, no statistically significant difference was found between the two groups. The results of the two tests are presented in Table 3.
Table 3
20-meter speed test and Illinois agility test results
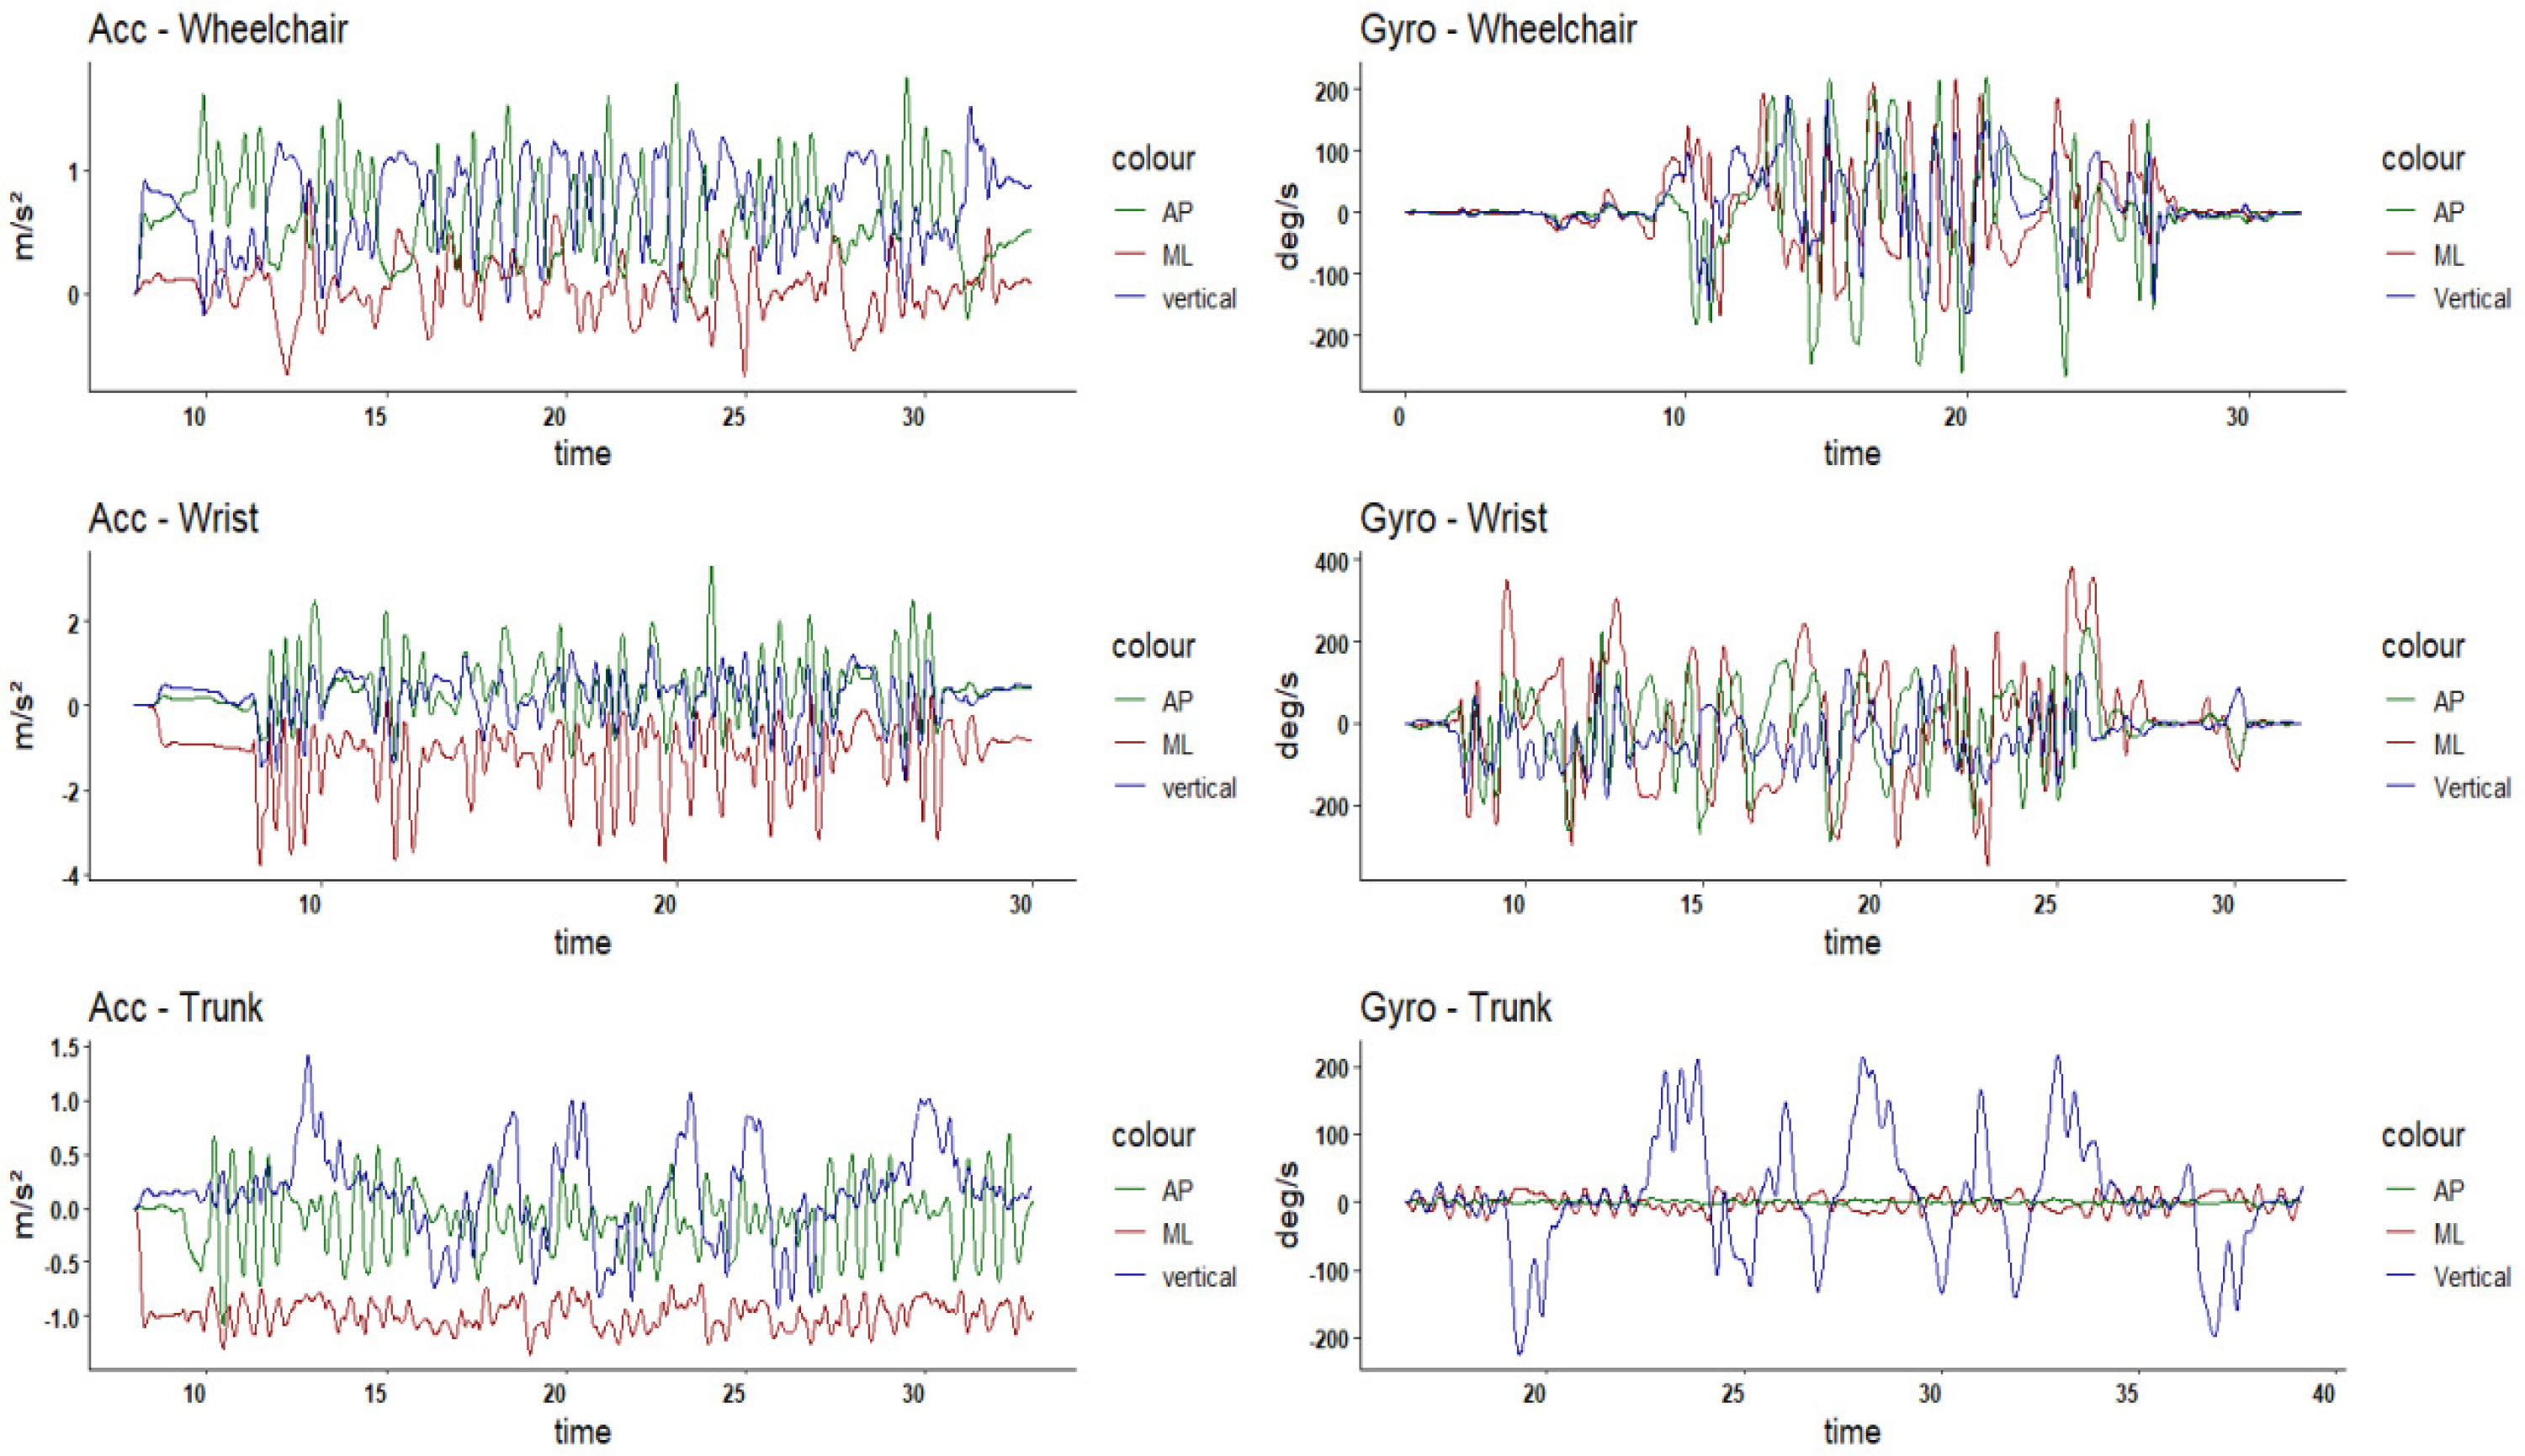
The linear acceleration signal and angular velocity of the low and high-class groups are given in Figures 1 to 4. It is possible to distinguish the movement patterns of high and low-class athletes based on the signals collected with the IMUs; this is particularly apparent for the trunk movement data, while the identified oscillations are less distinct for the wrist movements. For the 20-meter speed test, low-class athletes showed a predominance of linear acceleration oscillation in the AP (anteroposterior) and vertical axes, while high-class athletes also showed important oscillations in the ML (mediolateral) axis. In the Illinois agility test, the linear acceleration of the trunk of the lower-class athletes oscillated mainly in the ML and AP axes, while the oscillations for the high-class athletes mainly occurred in the AP and vertical axes.
Figure 1
Linear acceleration and angular velocity data of low-class athletes in the 20-meter speed test
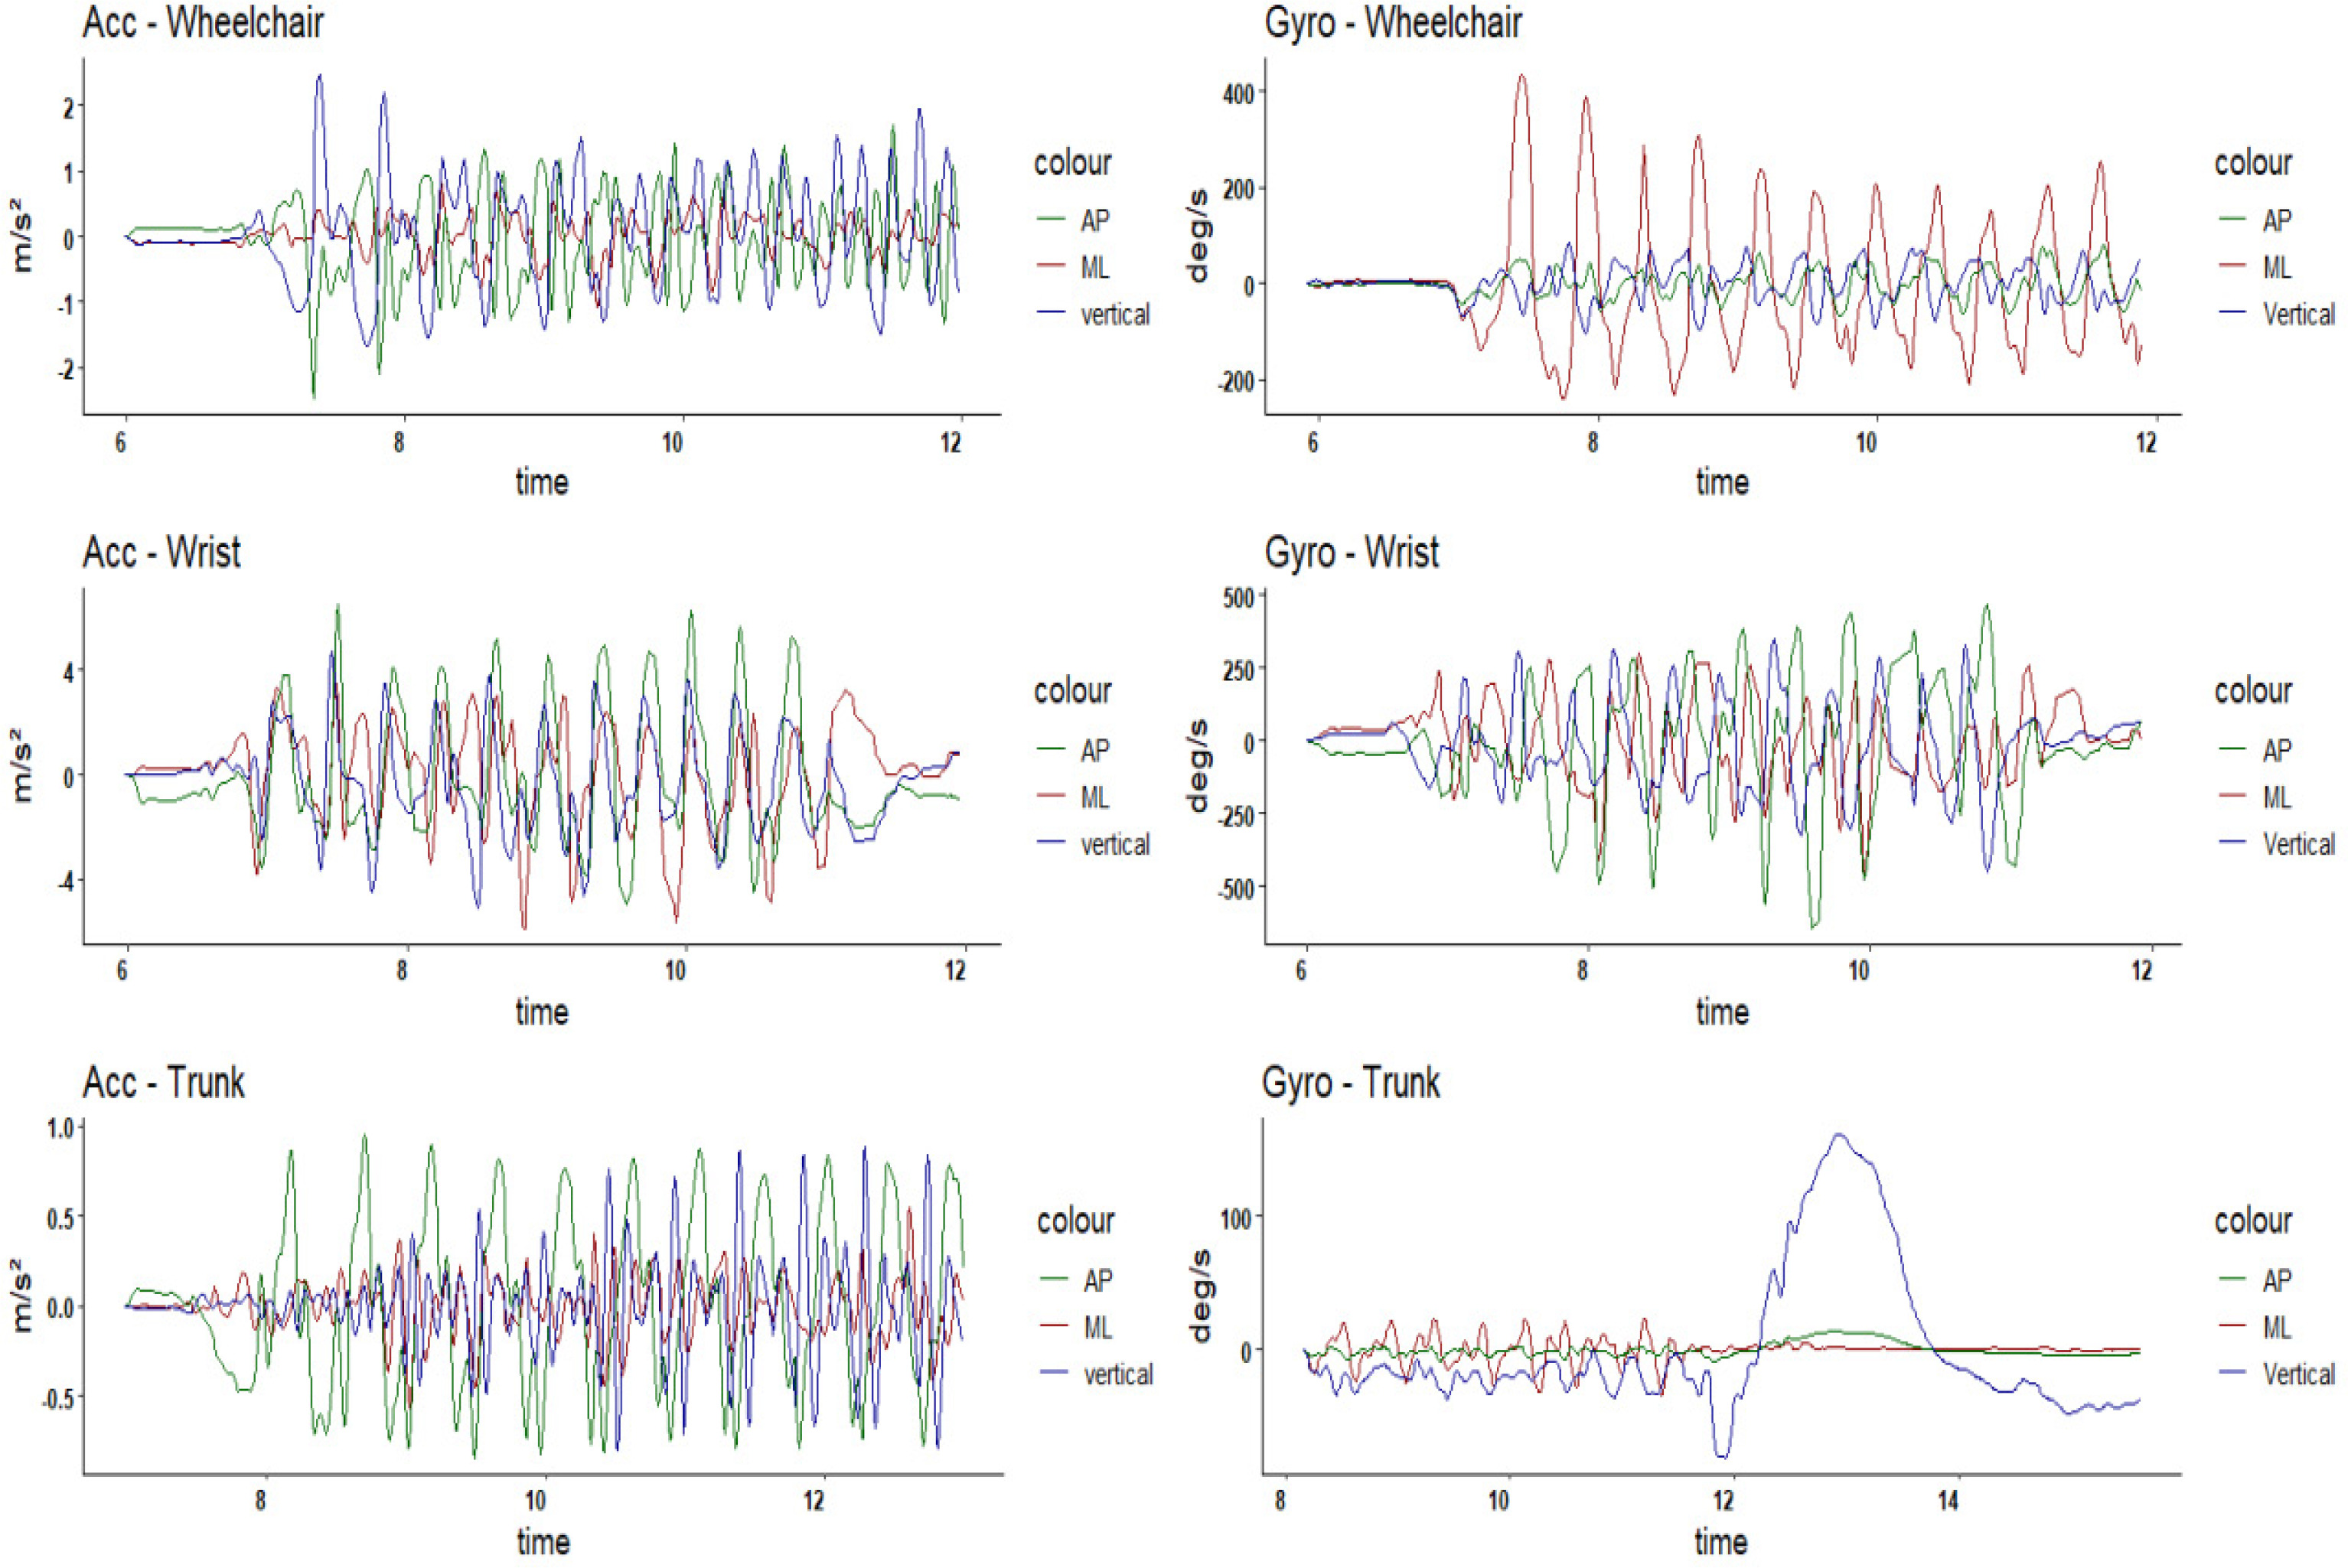
Figure 2
Linear acceleration and angular velocity data of high-class athletes in the 20-meter speed test
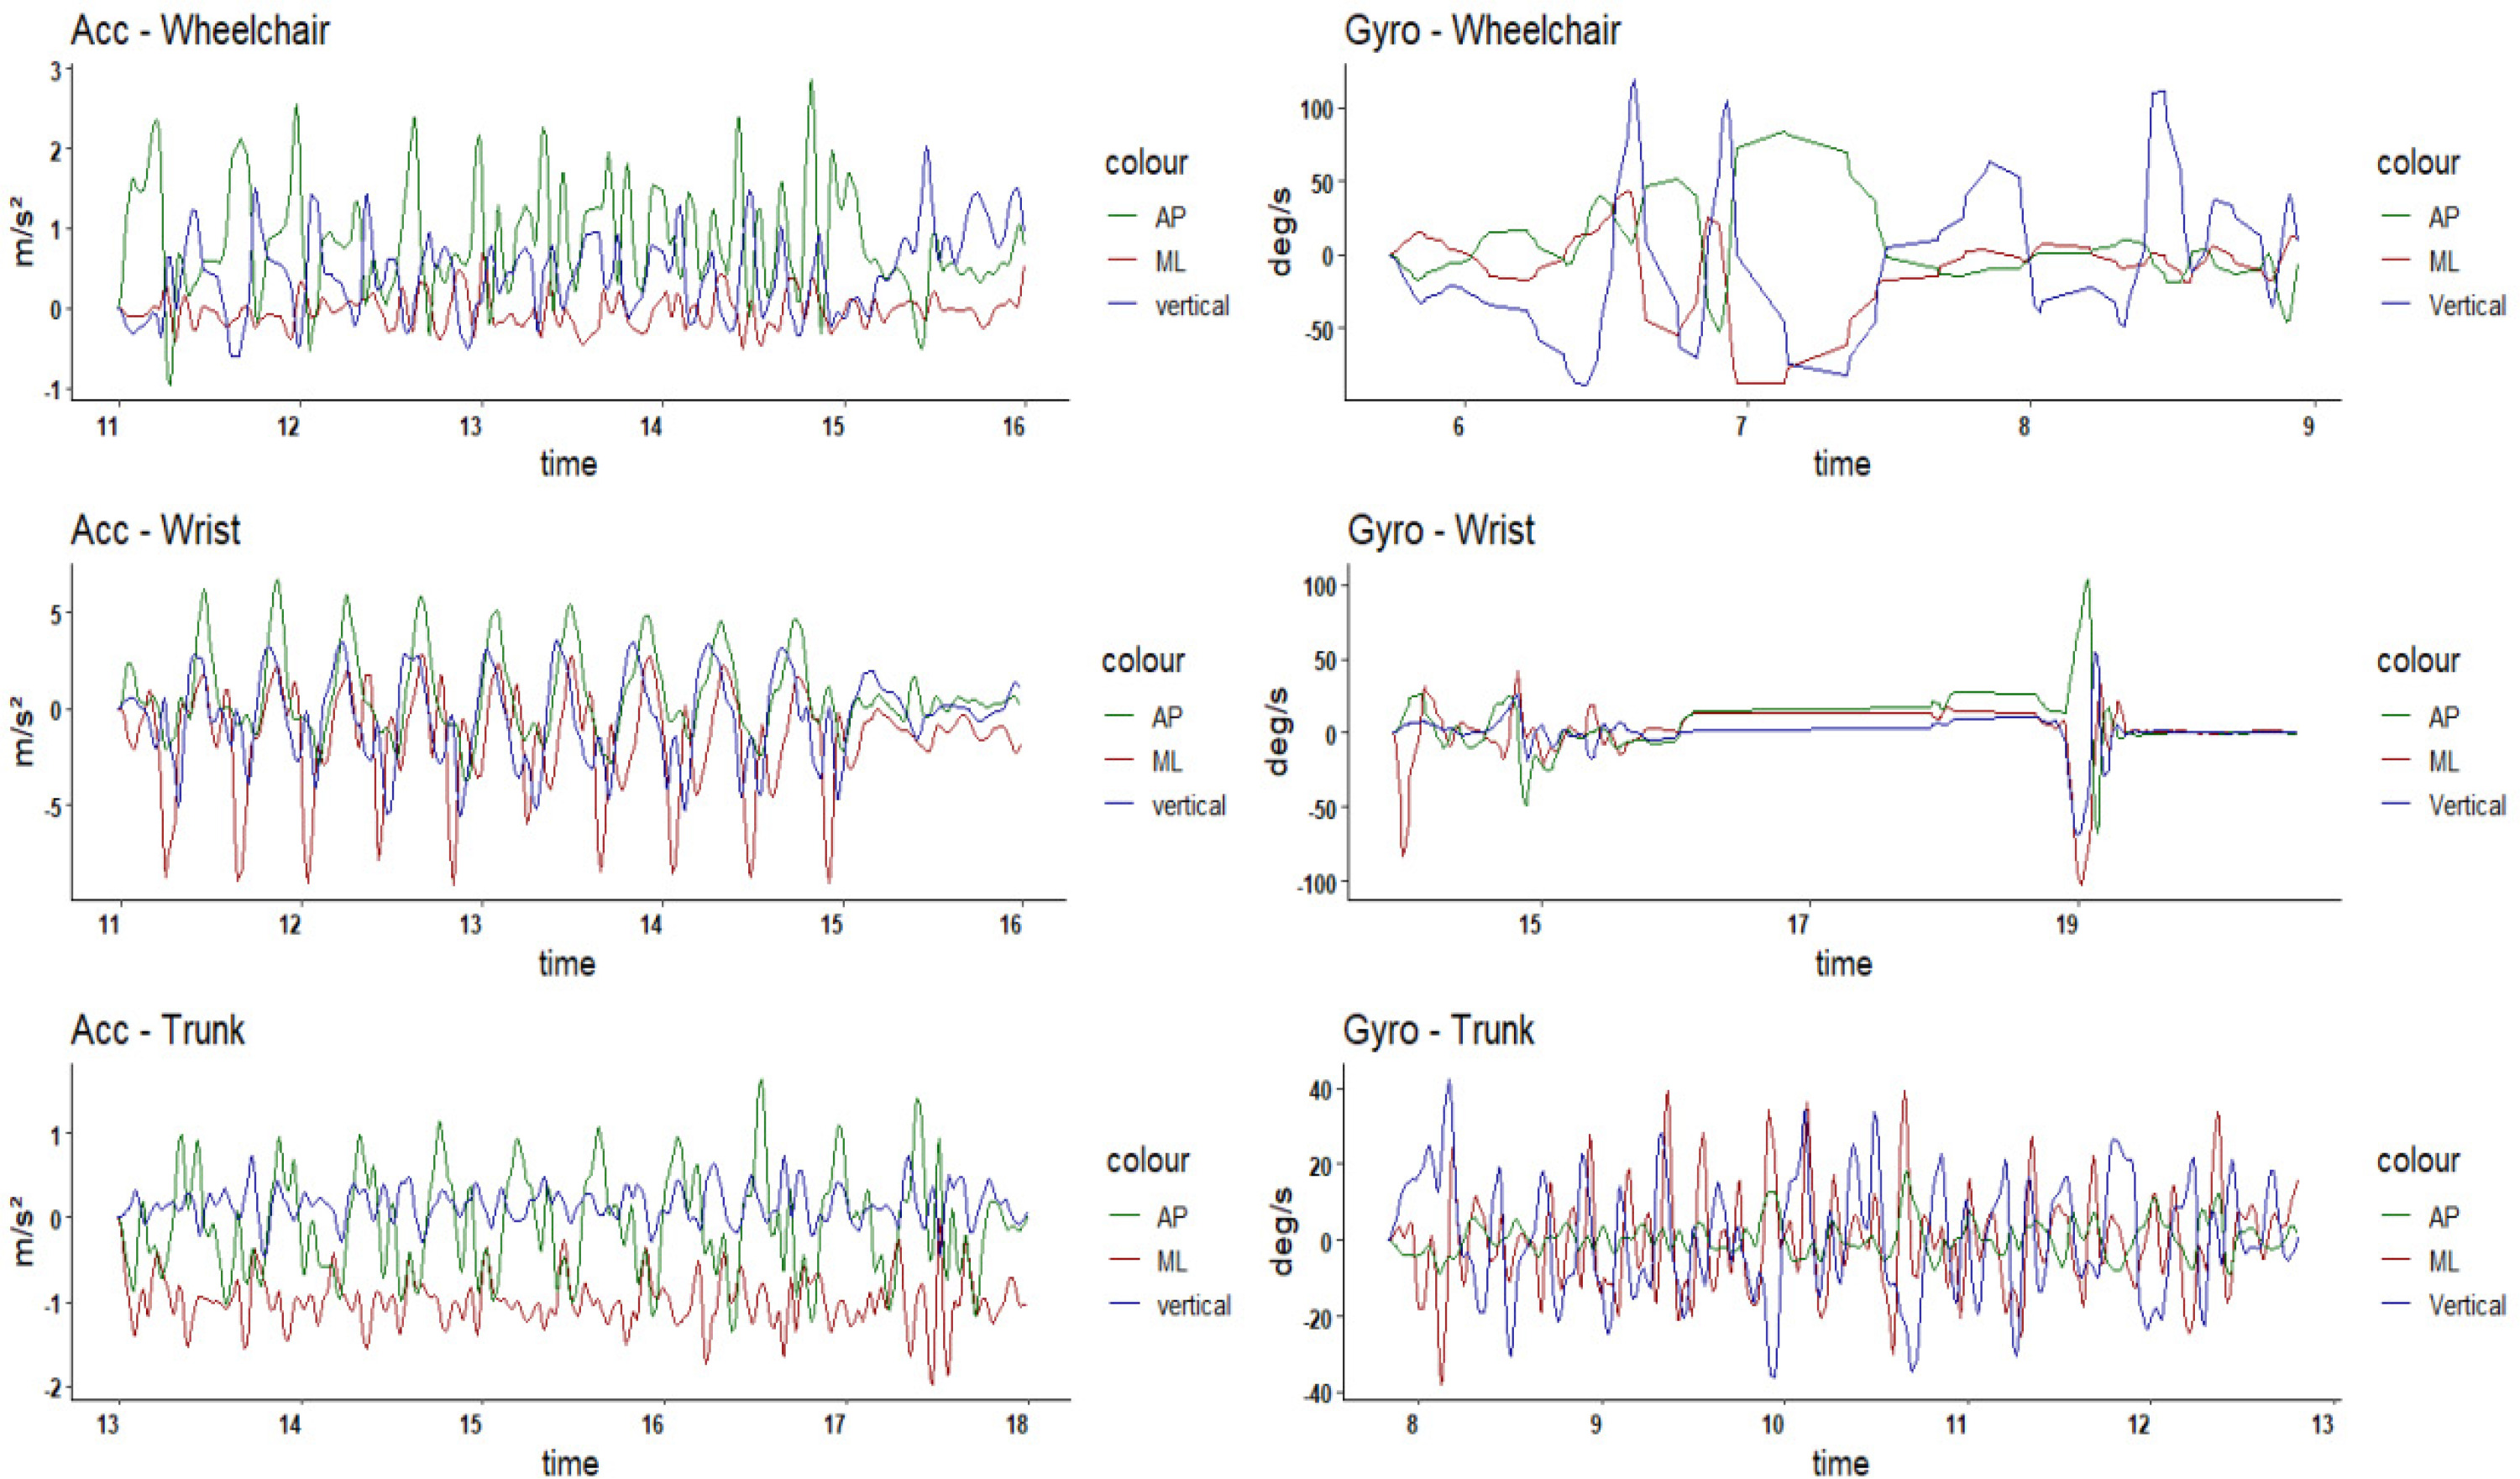
Figure 3
Linear acceleration and angular velocity data of low-class athletes in the Illinois agility test
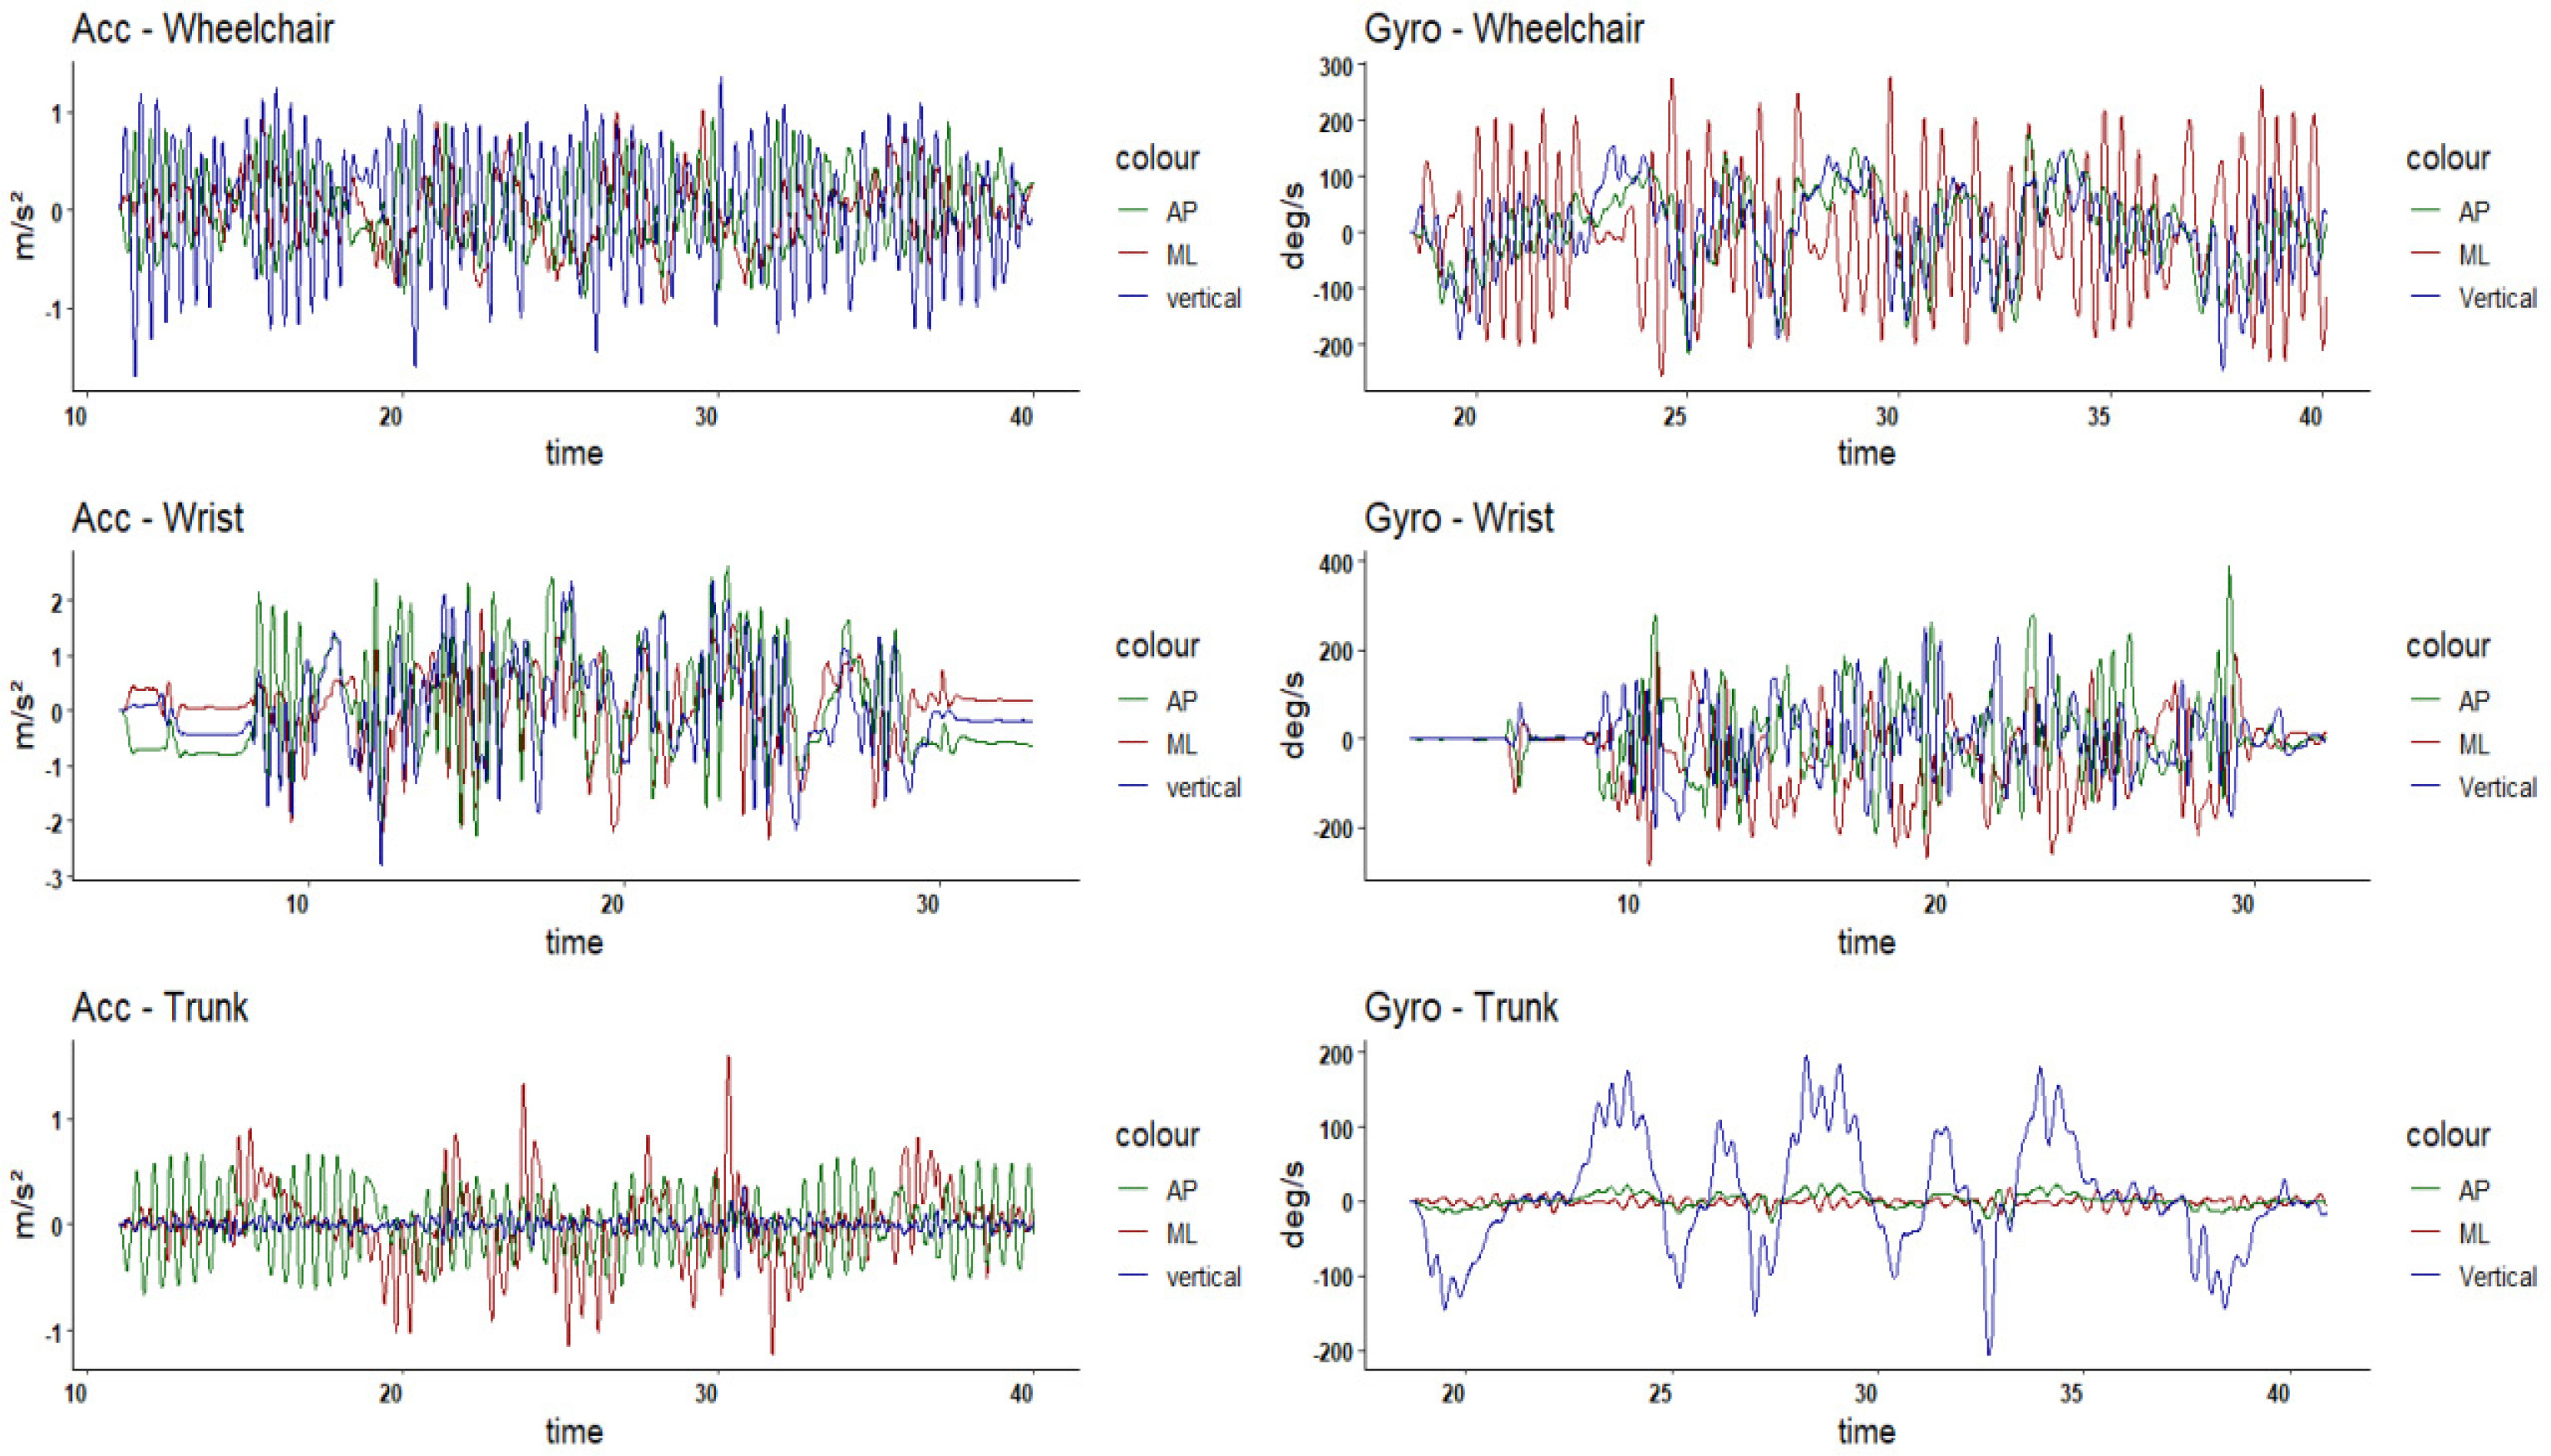
Figure 4
Linear acceleration and angular velocity data of high-class athletes in the Illinois agility test
Of the 64 extracted variables (3 IMU x positions x axis), only 16 showed moderate and strong significant correlations with sports class. For the data collected with the accelerometer in the 20-meter speed test, three variables showed strong and significant correlations with sport class: maximum linear acceleration in the anteroposterior direction (r = - 0.70, p = 0.02), wrist amplitude in the anteroposterior direction (r = - 0.71, p = 0.02), and median wrist in the anteroposterior direction (r = 0.81, p = 0.00). For the gyroscope data, a moderate and significant correlation was observed for kurtosis of angular velocity of the wheelchair in the anteroposterior direction (r = 0.67, p = 0.03).
In the Illinois agility test, the accelerometer data revealed two strong and significant correlations with sport class: median linear acceleration of the wheelchair in the mediolateral direction (r = - 0.86, p < 0.01) and kurtosis of linear acceleration of the wrist in the anteroposterior direction (r = 0.84, p < 0.01). Two other variables showed moderate and significant correlations with sports class: wheelchair kurtosis in the anteroposterior direction (r = 0.65, p = 0.04) and asymmetry of trunk acceleration in the anteroposterior direction (r = 0.68, p = 0.03). In addition, the gyroscope data showed moderate and significant correlations with mean wheelchair angular velocity in the anteroposterior direction (r = 0.70, p = 0.02), median wheelchair angular velocity in the resultant (r = - 0.65, p = 0.04), maximum wrist angular velocity in the mediolateral direction (r = 0.65, p = 0.04), and maximum angular velocity of trunk in resultant of three axes (r = - 0.77, p = 0.00). They also identified strong and significant correlations with median angular velocity of wheelchair in the anteroposterior direction (r = 0.70, p = 0.02), asymmetry of angular velocity of trunk in the anteroposterior direction (r = - 0.73, p = 0.01), and mean angular velocity of wrist in the vertical direction (r = - 0.64, p = 0.04). No other significant relationships were observed.
Regarding the positioning of the sensor, the variables collected from the IMU positioned in the wheelchair identified a greater number of strong and moderate correlations with sports class (n = 8). The sensor positioned on the wrist identified six variables that correlated moderately and strongly with the class, while those on the trunk only identified four variables (Table 4). The Illinois agility test revealed more variables correlated with sport class (n = 12) compared to the 20-meter speed test (n = 6). Of the tested axes of movement, the anteroposterior direction demonstrated the highest number of variables correlated with sport class (n = 12), followed by the mediolateral direction (n = 3), resultant (n = 2), and the vertical axis (n = 1).
Table 4
Correlations with sports class
| Variables | R | p - value |
|---|---|---|
| 20-meter speed test | ||
| Maximum linear acceleration in the anteroposterior direction | - 0.70 | 0.02 * |
| Wrist linear acceleration amplitude in the anteroposterior direction | - 0.71 | 0.02 * |
| Median linear acceleration wrist in the anteroposterior direction | 0.81 | 0.00 * |
| kurtosis of the angular velocity of the wheelchair in the anteroposterior direction | 0.67 | 0.03 * |
| Illinois agility test | ||
| Median linear acceleration of the wheelchair in the mediolateral direction | - 0.86 | 0.00 * |
| Kurtosis of the linear acceleration of the wrist in the anteroposterior direction | 0.84 | 0.00 * |
| Wheelchair kurtosis of the linear acceleration in the anteroposterior direction | 0.65 | 0.04 * |
| Asymmetry of trunk linear acceleration in the anteroposterior direction | 0.68 | 0.03 * |
| Mean wheelchair angular velocity in the anteroposterior direction | 0.70 | 0.02 * |
| Median wheelchair angular velocity in the resultant | - 0.65 | 0.04 * |
| Maximum wrist angular velocity in the mediolateral direction | 0.65 | 0.04 * |
| Maximum angular velocity of the trunk in the resultant | - 0.77 | 0.00 * |
| Median angular velocity of the wheelchair in the anteroposterior direction | 0.70 | 0.02 * |
| Asymmetry of the angular velocity of the trunk in the anteroposterior direction | - 0.73 | 0.01 * |
| Mean angular velocity of the wrist in the vertical direction | - 0.64 | 0.04 * |
DISCUSSION
The main aim of the study was to identify the optimal sensor positioning on the body and wheelchair frame of wheelchair basketball players, and to determine which configuration most accurately reflects differences in sport class based on IMU-derived variables. The findings demonstrated that athletes from higher sport classes completed the performance tests in shorter times and exhibited distinct movement patterns compared to athletes from lower classes. Among all the IMU variables extracted, sixteen showed moderate to strong correlations with sport class, with placement on the wheelchair frame yielding a higher number of significant associations than placement on the body. Additionally, the Illinois agility test revealed more class-related differences in movement characteristics than the 20-meter speed test.
Although athletes from higher sport classes showed shorter mean completion times than the lower-class group in the Illinois agility test and 20-meter speed test, these differences were not statistically significant. This result may be influenced by the limited sample size, which may have reduced the statistical power to detect between-group differences. Nonetheless, this tendency aligns with previous research indicating that sport class is associated with performance outcomes in skill-based tests, with higher-class athletes, typically with greater functional capacity and trunk control, achieving better results22–28. It is possible that the faster, albeit insignificant, times achieved by higher-class athletes may be due to their more effective use of trunk motion to assist in wheelchair propulsion and direction changes4; in contrast, lower-class athletes often experience reduced trunk stability, which can weaken propulsion force, maneuverability, and balance during rapid movements such as turning or accelerating.
In addition, during the performance tests, the sensors were able to identify different movement patterns between the two groups, with the greatest number of differences noted for the torso; in this position, high-class athletes were found to more fully exploit the ML axis to optimize their movements than the while low-class athletes. The latter group do not present active movements in the lateral plane, as defined in the International Wheelchair Basketball Federation (IWBF) classification code3, and cannot make use of this axis to optimize their movements. No previous studies have evaluated the trunk movement of Paralympic athletes using inertial sensors, and our findings should be seen as the first steps for discussions in this area. However, they are in accordance with previous data on the trunk control of wheelchair rugby athletes obtained by the seated limit of stability (LoS) on a force platform, which demonstrated that functional class groups have different degrees of trunk control (p = 0.028)29. In addition, a previous study evaluating trunk movement found strong agreement between inertial measurement units (IMUs) and a gold-standard assessment technique during sports-specific tasks (r ≥ 0.85; r² ≥ 0.80)30, which lends support our current findings.
No difference in movement pattern was found between the groups with regard to the wrist measurements. This is expected since the athletes did not present any differences in the upper limbs, with the trunk being the main factor for the sport class. A previous study using inertial sensors found wheelchair rugby athletes with coordination impairment to exhibit compromised performance in some tasks compared to those of the same functional class but without impairment31. These results show that athletes with motor impairment, such as cerebral palsy, have lower efficiency in upper limb movements, and that this can justify a lower functional class even with a strong trunk; hence, the upper limbs can affect the functionality of wheelchair sports athletes.
In the 20-meter speed test, the athlete travels a distance in a straight line. Therefore, it is expected that there will be greater oscillations of the chair, wrist, and trunk in the anteroposterior and vertical directions compared to the Illinois agility test. For this test, the lower class athletes demonstrated greater maximum acceleration of the wheelchair and amplitude of acceleration of the wrist in the anteroposterior direction. In contrast, the higher class athletes exhibited greater values for acceleration and for the median angular velocity of the wrist, median kurtosis of the angular velocity of the wheelchair in the anteroposterior direction, and mean angular velocity of the wrist in the vertical direction.
Our findings corroborate those of Van Der Slikke12, who assessed whether performance measures collected through inertial sensors could offer an alternative basis for classifying wheelchair basketball athletes. The study used single sensors positioned on each axis of the rear wheel and another on the rear chassis bar, to determine the acceleration and velocity in the anteroposterior and rotational planes. The findings indicate lower values in lower-class groups of athletes (1.0 and 1.5) when compared with middle-class (2.0, 2.5, 3.0 and 3.5) and high-class (4.0 and 4.5) groups. They also demonstrate that acceleration and speed are directly proportional to sport class.
In the present study, the positioning of the IMU in the wheelchair obtained the highest number of variables correlated with the sport class. Significant correlations were also observed for the positioning of the trunk, suggesting that IMUs placed in this location can play a crucial role in assessing athletic performance. Indeed, previous studies also emphasize the importance of correct inertial sensor positioning to accurately capture complex movements32. Furthermore, the significant correlation observed between trunk positioning and sports class reinforces the important role played by trunk control in the performance of wheelchair sports athletes, and confirms previous studies suggesting that trunk control is a determining factor in the functional classification of athletes33,34. The wrist position exhibited the least number of correlations; as the athletes did not have any impairment in the upper limbs, this would not interfere with their classification. This aligns with the IWBF functional classification, which primarily considers trunk and upper limb control for athlete categorization6.
The Illinois agility test had a greater number of moderately and strongly correlated variables (n = 12) than the 20-meter speed test. This may be related to the presence of more movement elements: in addition to propulsion, the test requires the performance of turning movements to both sides28,35. Due to the number of turns involved in the test, oscillations were anticipated across all movement axes, along with a higher volume of data captured by the gyroscope. This pattern was confirmed in the results.
In the Illinois agility test, based on the accelerometer data, athlete class demonstrated a strong positive correlation with the following: kurtosis of wrist acceleration, kurtosis of wheelchair acceleration and asymmetry of trunk acceleration in the anteroposterior direction, mean wheelchair angular velocity, and maximum wrist angular velocity, both in the mediolateral and median direction of the angular velocity of the wheelchair in the anteroposterior direction. Therefore, it would seem that higher values for these acceleration and angular velocity parameters in the Illinois agility test would be indicative of a higher class athlete. Similar results were obtained in previous research, where athletes of lower classes performed at lower speeds and acceleration compared to higher-class athletes34.
For example, Usma-Alvarez et al.35 investigated the potential of assessing tangential speed and turning radius achieved during the Illinois agility test for evaluating wheelchair rugby athletes. Inertial sensors (accelerometers and gyroscopes) positioned in the anterior region of the wheelchair were used. The findings indicate lower speeds in the middle and low-class groups compared to the higher-class groups, with significant differences observed between the groups. The proposed method hence proved to be valid for assisting in assessing athletic performance in wheelchairs through the Illinois agility test for training purposes.
Regarding sensor positioning, the variables collected with the sensor positioned in the wheelchair presented a greater number of strong and moderate correlations with sports class. This may be related to the fact that the wheelchair is the most stable place. In general, in studies using sensors in wheelchair sports, the sensors are positioned on the wheel rim, central axle shaft and anterior region of the wheel-chair7,12,35,36.
Regarding axis of movement, the highest number of variables correlated with sporting class were associated with the anteroposterior direction. Both this axis and the vertical axis are significant in wheelchair propulsion. When propelled, the wheelchair is accelerated in the anteroposterior axis, with the trunk and wrist also oscillating along this axis. During maximum propulsion, the trunk performs flexion and extension movements, while the wrist touches the wheelchair, pushing it forward37,38.
Hence, it appears that the use of inertial sensors is feasible for supporting the process of classifying wheelchair basketball athletes. Although our data is still preliminary, they suggest that certain variables can be used for the functional assessment of athletes based on inertial sensors. Furthermore, the sensor itself is easy to use. However, it is necessary to create valuation standards and reference values.
The use of technology in sports environments is a growing and seemingly irreversible trend, with the potential to enhance both performance and competition standards. Technological tools have already been incorporated in studies focused on evidence-based classification39, and our present findings contribute to ongoing discussions in this area.
Due the limited number of participants included in this preliminary study, care should be taken when generalizing its findings; however, increasing the sample size may help to identify additional significant correlations, and this should be included in future research. Furthermore, future studies could benefit from incorporating more advanced analytical approaches, such as Principal Component Analysis (PCA) and machine learning techniques. PCA is a dimensionality reduction method that transforms a large set of correlated variables into a smaller set of uncorrelated components, capturing the most relevant information in the data. Applying PCA could facilitate the identification of movement patterns that differentiate functional classes, supporting more standardized and objective athlete classification.
CONCLUSIONS
Our findings indicate that sensor position, test type, and movement axis, especially the anteroposterior direction, play important parts in supporting the process of athlete classification. In addition, the wheelchair appears to be the most suitable location for IMU sensors. The data from the IMU was able to identify different patterns of wheelchair and trunk movement in athletes from low and high sport classes, which supports the use of these sensors in the process of classifying wheelchair basketball athletes.