


INTRODUCTION
Parabadminton (PBd) is a relatively new sport in the Paralympic program, having debuted at the Tokyo 2020 Paralympic Games (held in 2021)1. While PBd follows similar rules to traditional badminton, the rules are designed to accommodate athletes with various types of physical impairments2. The sport is overseen by the Badminton World Federation and includes six sport classes based on the functional profile: two for wheelchair users (WH1 and WH2) and four for standing athletes (SL3, SL4, SU5, and SH6)3. Classification is based on the type and severity of impairment, and whether it affects trunk control, limb function, and movement. WH1 athletes have the most severe impairments, while WH2 have better trunk and arm function. SL3 and SL4 include athletes with lower limb impairments, with SL3 being more severe; SU5 involves upper limb impairments, and SH6 includes athletes with short stature. WH1, WH2, and SL3 compete on half courts, while SL4, SH5, and SH6 play on full courts. These classifications and court divisions promote fair play and athlete safety3.
In Paralympic sports, classification remains a key and evolving issue. It not only helps maintain fairness but also reflects how impairments impact sports performance. Therefore, to improve the accuracy of classification and training practices, there is a need to more fully understand the various performance-related factors among the different PBd sport classes4. Key performance indicators in racket sports generally include technical skills, tactical decision-making, physical fitness, and functional movement ability. Among these, physical fitness and movement skills, especially agility and directional control, are considered vital for success in PBd5,6.
One factor playing a fundamental role in racket sports is change of direction (COD) ability, as athletes must respond quickly and efficiently to shuttlecock trajectories in various directions. In traditional badminton, COD performance has been consistently linked to match success, while requiring high-level physical conditioning7,8. In PBd, where the athletes may experience a range of movement restrictions due to different impairments, COD plays a much greater role in their performance. Clearly, an understanding of COD can be used to enhance functional potential and guide customized training; however, the precise nature of the role of COD among PBd athletes remains poorly understood8. Likewise, anthropometric measures, such as skinfold thickness and arm circumference, are key indicators of body composition and muscle development, which may impact sport-specific actions like reach, control, and stability6,9. However, these factors are also understudied in PBd, especially regarding their possible relationship with COD.
Given these gaps, there is a clear need for research exploring how physical performance indicators vary across PBd sport classes and how they may be influenced by anthropometric variables. Understanding these relationships is essential for designing effective training programs and for advancing the PBd classification system. A clear view of the particular physical traits contributing to performance, will allow more precise refinement of eligibility criteria and more accurate athlete assessment within each class10,11. Therefore, the aims of this study are twofold: (a) to compare COD indicators among PBd athletes in different sport classes, and (b) to investigate the influence of anthropometric factors on their COD parameters. The authors hypothesize that PBd athletes will display distinct COD performance profiles within each sport class category, with expected variability among both standing and wheelchair classes, particularly between those competing on half court and full court.
MATERIALS AND METHODS
Participants
A total of seventy-nine PBd athletes participated in this study (mean age: 29 ± 13.5 years; weight: 61 ± 14.1 kg; height: 1.65 ± 8.21 cm). The athletes were classified into two main sport classes: 24 in the wheelchair (WH) class (WH1 = 9; WH2 = 15) and 55 in the standing (ST) class (SL3 = 13; SL4 = 15; SU5 = 13; SH6 = 14), all competing at national or international levels.
The eligibility criteria comprised the following: (1) holding an official sport class status recognized by the Badminton World Federation (BWF), (2) having competed in at least one official national or international championship, and (3) being in suitable physical condition to participate (e.g., free of pain or injury, particularly regarding wheelchair propulsion).
Participants were recruited during BWF-sanctioned tournaments. Invitations were sent through official event communication channels. All participants provided informed consent before enrolment; this was provided by their legal guardians in the case of underage athletes. The study was approved by the Institutional Review Board at the lead author’s institution (protocol no. 5.982.980) and conducted with formal acknowledgment and support from the BWF, ensuring compliance with ethical and organizational standards. All physical assessments were completed on a single day, scheduled to avoid interference with matches and to respect athletes’ rest periods. The tests posed minimal risk, and the procedures were designed to ensure the safety and comfort of participants.
Demographics and anthropometric data
Demographic information for each athlete was collected using a paper-based questionnaire designed by the researchers. The questionnaire was administered in person at the competition venue (i.e., sports gymnasium) and included personal details (e.g., age and sex), anthropometric measurements, length of experience (in PBd), and sport classes. The morphological profiles of the athletes were characterized using the sum of five skinfold measurements (triceps, biceps, suprailiac, middle axillary, and abdominal); these were chosen due to the accessibility of anatomical points for measurement12. The measurements were taken with a Lange skinfold caliper (Beta Technology, USA), which applies a constant pressure of 10 g/mm² and has a precision of 1 mm. In the absence of specific tests for assessing body fat in individuals with physical impairment, body adiposity was estimated based on the sum of skinfold measurements.
Additionally, the circumference of the right arm (or the functional arm in cases of morphological limitations on the right side) was measured to determine the arm muscle area (AMA), following the method outlined by Frisancho13:
All anthropometric measurements were performed by two trained and similarly-experienced researchers, one male and one female: the male athletes were assessed by the male researcher, while the female athletes were assessed by the female researcher, in line with international guidelines and specific standardization protocols for individuals with physical impairments12. The assessments took place in a designated private area at the competition venue, ensuring confidentiality and comfort. Athletes wore light sportswear during the measurements. Measurements were taken before the competition to minimize the influence of fatigue or fluid retention. No specific dietary standardization was required on the day of the assessments.
Measurement of maximum specific change of direction capability
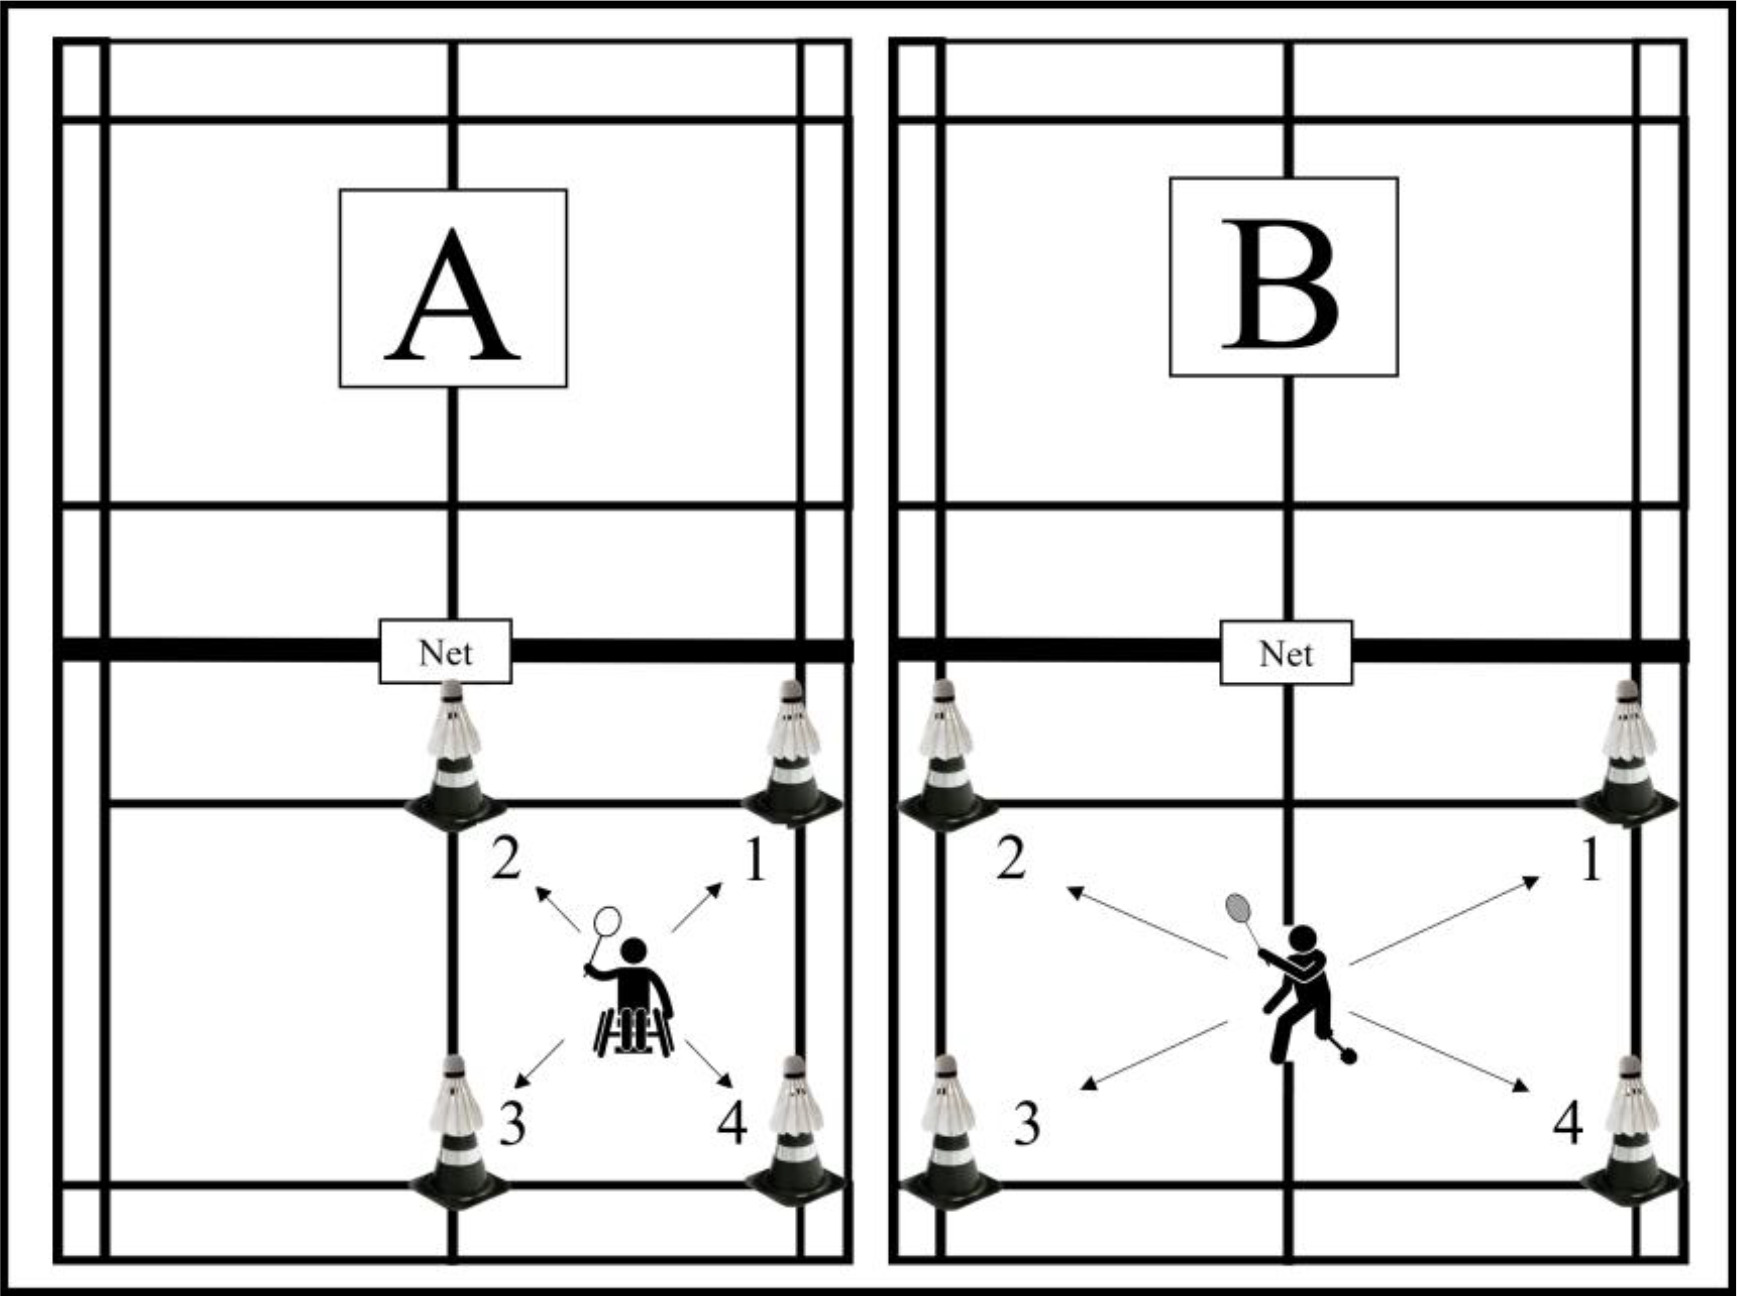
The test was conducted on an official PBd court and took place over a single day; the procedure was based on those used in previous studies involving badminton athletes with physical impairments8 and those without14,15. The athletes were instructed to move quickly toward cones (40 centimeters tall) placed at each end of the court, then return to the center point for each diagonal movement, involving movement between four points on the court (Figure 1). To mimic real game conditions, shuttlecocks were placed on top of each cone for athletes to knock down with a touch. Each athlete completed 10 repetitions (a full circuit), with a 30-second interval between repetitions. Either a full court or half court were used depending on the sport class, i.e. Standing or Wheelchair. Throughout the test, two experienced researchers monitored the procedure, effort exerted, and rest time between attempts. In a pilot study, the test showed good inter-rater reliability, i.e. between two experienced researchers, as indicated by Kappa coefficients ranging from 0.70 to 0.8516.
Figure 1
Change of direction-specific test for PBd athletes. Panel (A) for WH1, WH2 e SL3 athletes; Panel (B) for SL4, SU5 e SH6 athletes
The following variables were analyzed: a) worst time (in seconds), b) best time (in seconds), c) mean time (in seconds), and d) fatigue index (%) (FI%), calculated using the equation:
Statistical analysis
The normality of the data was assessed using the Shapiro-Wilk test. As some variables violated the assumption of normality, the initial analysis was conducted using non-parametric tests. The COD indicators were compared between athletes of different sport classes using the Kruskal-Wallis test, along with effect size (f 2), followed by the post hoc Dwass-Steel-Critchlow-Fligner (DSCF) tests. This was followed by a multivariate analysis of covariance (MANCOVA), accounting for potential mediating characteristics in the comparisons. The analysis model included the following covariates: age, body mass, height, body mass index, arm muscle area, corrected arm circumference, sum of skinfolds, length of experience and sex. Sport class and type of physical impairment were used as independent variables, and the evaluated COD indicators as dependent variables. Effect size (f 2) was interpreted as follows: Small: f 2 ≥ 0.1; Medium: f 2 ≥ 0.25; Large: f 2 ≥ 0.416. All analyses were performed using the JAMOVI software (version 2.3.18.0, USA), with a value of 5% considered significant (p < 0.05).
RESULTS
The studied athletes are characterised in Table 1.
Table 1
The demographic, anthropometric, and sport-related characteristics of the evaluated sample
| Demographics and Characteristics | Total (mean ± standard deviation) | Min/Máx |
|---|---|---|
| Age (years) | 29.0 ± 13.5 | 18/54 |
| Sex Male (M) Female (F) | 54 25 | NA |
| Sport classes WH1 WH2 SL3 SL4 SU5 SH6 | Sex (F and M) 9 (F = 4; M = 11) 15 (F = 4; M = 6)) 13 (F = 5; M = 8) 15 (F = 1; M = 14) 13 (F = 6; M = 7) 14 (F = 5; M = 9) | NA |
| Physical impairment Spinal cord injury Poliomyelitis and Spina Bifida Amputations Congenital malformations Short stature Cerebral palsy and similar sequelae | 16 9 5 20 14 15 | NA |
| Length of experience (months)* | 48.0 ± 44.0 | 003/468 |
| Body mass (kg) | 61 ± 14.1 | 27/124 |
| Height (meters) | 1.65 ± 8.21 | 1.15/1.87 |
| Body Mass Index (kg.m2) | 23.0 ± 4.98 | 16.5/51.2 |
| The sum of five skinfolds (mm) | 101.0 ± 50.5 | 028/208 |
| Arm muscle area (cm2) | 4.78 ± 0.65 | 3.01/7.45 |
| Corrected arm circumference (cm) | 30.3 ± 4.15 | 19.2/47.6 |
The COD-related values from different sport classes are compared in Table 2, with covariates used to identify their respective influences. Statistically significant differences were observed for all COD indicators between sport classes, except for the fatigue index (p = 0.085).
Table 2
COD values among the evaluated sport classes (values expressed as median and interquartile range)
Post hoc tests revealed differences in the variable worst time between classes SL4 and SH6 (p = 0.036), SL4 and WH2 (p < 0.001), SL4 and WH1 (p < 0.001), SH6 and WH2 (p < 0.001), SH6 and WH1 (p = 0.002), SU5 and WH2 (p < 0.001), SU5 and WH2 (p = 0.001), SL3 and WH2 (p < 0.001), and between SL3 and WH1 (p = 0.001), for all comparisons f 2 = 0.702 (large effect).
Similarly, significant differences in mean time were observed between classes SL4 and SH6 (p = 0.003), SL4 and WH2 (p < 0.001), SL4 and WH1 (p < 0.001), SH6 and SU5 (p = 0.004), SH6 and SL3 (p = 0.036), SH6 and WH2 (p < 0.001), SH6 and WH1 (p = 0.001), SU5 and WH2 (p < 0.001), SU5 and WH1 (p = 0.001), SL3 and WH2 (p < 0.001), and between SL3 and WH1 (p = 0.001); for all comparisons, f 2 = 0.753 (large effect).
Significant differences in best time were observed between SL4 and SH6 (p = 0.005), SL4 and WH2 (p < 0.001), SL4 and WH1 (p < 0.001), SH6 and SU5 (p = 0.005), SH6 and SL3 (p = 0.013), SH6 and WH2 (p < 0.001), SH6 and WH1 (p = 0.001), SU5 and WH2 (p < 0.001), SU5 and WH1 (p = 0.001), SL3 and WH2 (p < 0.001), and between SL3 and WH1 (p = 0.001); for all comparisons, f 2 = 0.750 (large effect).
Significant differences in mechanical work were observed between SL4 and WH2 (p < 0.001), SL4 and WH1 (p < 0.001), SH6 and WH2 (p = 0.046), and between SH6 and WH1 (p = 0.011); for all comparisons, f 2 = 0.058 (small effect).
For all variables associated with temporal parameters (worst time, mean time, total time, and best time) significant differences were noted between the WH and standing classes, and between classes SU5 and SH6 and classes SL3 and SL4 (p < 0.05); however, no such significant differences were found between the two WH classes. For comparisons related to the Fatigue Index, no significant differences were found between any WH or Standing classes.
The MANCOVA data (Table 3) indicates that age, body mass, height, and length of experience influence COD profiles in the athlete group, considering both sport class and type of physical impairment. Greater height and body mass affected acceleration and deceleration, while older athletes showed slower COD, likely due to reduced muscle power. A greater length of experience is associated with better performance, highlighting the role of training experience in this context.
Table 3
Multivariate covariance analysis (MANCOVA) for the tested independent variables (sport classes and type of physical impairment)
DISCUSSION
The present study had two objectives: a) to compare COD indicators among athletes of PBd in different sport classes; and b) to examine the influence of anthropometric factors on COD parameters. The main findings support our hypothesis, revealing distinct COD performance profiles within and between sport class categories. Notably, WH1 and WH2 athletes demonstrated lower performance than the other classes, including some half-court standing players (e.g., SL3), highlighting the functional impact of wheelchair use. Also, significant differences were observed across nearly all COD indicators; these were also characterised by large effect sizes, particularly for best, mean, and worst times. The MANCOVA results showed that age, body mass, height, and length of experience significantly influenced COD, while the fatigue index did not differ between athlete class. Greater height and body mass were associated with better acceleration and deceleration capacity, whereas older athletes showed slower COD, possibly due to reduced muscle power. Length of experience was linked to improved performance. These results underscore the importance of maintaining physical fitness (e.g., body mass) in PBd athletes, and the need to identify individual characteristics (e.g., height) that may offer competitive advantages within specific sport classes.
Typically, athletes in wheelchair classes (WH), characterized by spinal cord injury, face challenges that significantly impact their physical condition, particularly with regard to muscle strength, power, anaerobic endurance, and aerobic capacity2,17. It is widely recognized in the literature that individuals with spinal cord injuries often experience a notable increase in body fat percentage, together with a chronic and substantial reduction in skeletal muscle mass and bone mineral density18,19. These conditions, compounded using a sports wheelchair for mobility, further exacerbate COD indicators in these athletes. In particular, athletes in the WH1 class, who often have greater trunk and upper-body impairments, may require additional postural adjustments, impacting their speed and efficiency in COD maneuvers20. Moreover, these performance outcomes may be influenced by the process of adapting to a sport-specific wheelchair, which would offer improved trunk support and greater upper-limb leverage. These findings underscore the importance of tailored training strategies that enhance trunk control, upper-limb strength and propulsion techniques to mitigate these limitations and improve COD performance in wheelchair classes21.
Previous studies in wheelchair sports, such as wheelchair rugby, have emphasized the critical role of trunk control in executing quick and efficient directional changes, especially during dynamic play involving rapid forward and backward propulsion movements20,22,23. The forward propulsion of the wheelchair involves a movement that necessitates active trunk control to maintain slight flexion and transition smoothly to the next position24. In the present study, rapid direction shifting was also evaluated in the COD test, a task that demands active trunk engagement for effective wheelchair handling. Indeed, training methods focussing on trunk stabilization and upper-limb coordination have been shown to improve agility and on-court movement in wheelchair tennis, among others.
These insights are relevant for PBd, as similar demands are placed on athletes during short, explosive movements within the confined space of the court. Our findings suggest that WH athletes, particularly those with limited trunk control, may benefit from incorporating training strategies used in wheelchair tennis, such as core strengthening, propulsion technique refinement, and sport-specific wheelchair handling drills, to enhance COD performance25,26.
However, it is important to interpret these results carefully, as the typical game dynamics in wheelchair PBd may not require the same frequency or intensity of COD actions as those seen in standing classes. This contextual difference limits the direct transfer of some performance indicators and training strategies. Therefore, practical applications should consider the specific movement patterns and constraints of wheelchair play when designing targeted conditioning programs. Notably, SL3 athletes, who also compete on half court, demonstrated superior COD performance compared to WH classes; this indicates that the functional limitations associated with sitting position and trunk impairment remain critical performance determinants, despite court size similarities. These findings highlight the potential for targeted training interventions to help mitigate such limitations.
Among the tested athletes, those in the SU5 class exhibited the most favorable results for COD indicators. This outcome was anticipated due to the resemblance between the SU5 class and the playing style seen in badminton6. This class includes athletes with physical impairments that generally affect only one arm, allowing them to perform most movements required in badminton with minimal modifications. Notably, no differences in COD performance were observed between classes SL3 and SL4, both of which are characterized by significant limitations in lower limb function. Although both classes may include athletes with similar impairments (such as cerebral palsy or limb deficiency), they mainly differ in the court size used during competition: a half court for SL3 and a full court for SL4. The use of a halfcourt for SL3 athletes is a deliberate adjustment intended to promote fairer and safer gameplay by accommodating the reduced balance and locomotor capacity of the athletes; this change may also help balance COD performance demands between the classes, despite differences in physical potential. Practically, these findings suggest that coaches should customize training routines based on the specific spatial and functional requirements of each class. For SL3 athletes, focus should be on short-distance agility, reaction time, and balance in limited space, while SL4 athletes may benefit from exercises involving larger court coverage and sustained directional changes. Furthermore, the results highlight the need to develop more precise assessment tools that reflect the functional and competitive realities of each sport class, as seen in other Paralympic sports27,28.
The observed relationship between anthropometric factors and COD performance is in line with previous findings from both para-sports29 and badminton30, where body mass, height, and muscle composition were found to significantly impact agility and movement efficiency. In traditional badminton, taller athletes often exhibit an advantage in covering the court more effectively, leveraging their reach for quicker interceptions and extended lunges31,32. Similarly, in PBd, height may facilitate more efficient directional changes, especially for standing athletes, by reducing the number of steps or wheelchair adjustments needed to reach the shuttle. However, unlike in badminton, where excessive body mass can provide stability in powerful smashes while potentially limiting speed, in PBd, higher body mass may pose greater challenges, especially for wheelchair athletes, due to increased inertia and the need for higher propulsion forces during rapid COD movements. The fact that length of experience as a para-athlete plays a significant role in performance further reinforces the importance of sport-specific adaptations, as experienced athletes likely develop movement patterns that optimize their physical characteristics33.
Some impairments are more strongly linked to weight gain and increased adiposity, both as a result of the underlying condition and reduced physical activity levels caused by limited mobility34. While the anthropometric methods used in the present study to estimate body fat have some limitations, the results suggest that body weight and BMI significantly affect COD performance. This decline seems to be related to the severity of the impairment, as shown by lower COD scores in the WH classes (Table 2). Even among a sample composed solely of athletes, the volume of sports activity alone did not appear to lead to favorable changes in body composition. This may highlight the need for targeted modifications in exercise and dietary routines for specific groups of athletes. Although the potential impact of such interventions is acknowledged, there is currently no information on the dose–response relationship of training and nutritional strategies in PBd athletes.
This study has several notable limitations. Firstly, athlete selection relied on voluntary participation, which was contingent upon the availability of athletes during competitions. This approach may have led some volunteers, particularly those in advanced stages of tournaments to opt out of participating. Secondly, the matches for classes that use wheelchairs (WH1 and WH2) involve fewer COD actions; as such, these results should be interpreted with caution for these classes, as their match dynamics rely more on linear displacements and positional adjustments than on frequent direction changes. In addition, the COD evaluation method used in the study was adapted from a test designed for badminton. Although this adapted test has been used in previous studies, it has not been formally validated for athletes without disabilities or para-athletes, and there currently exists no COD test specifically validated for athletes with physical impairments. This lack of validated tools may affect the accuracy and applicability of the results. Finally, the participants were evaluated using an anthropometric protocol validated in the general population; while this method has limitations, bias was minimized by using the sum of skinfolds as an alternative to estimate adiposity. This approach is recommended when validated equations for athletes with disabilities are unavailable, and encourage further research in this area within the PBd population.
Future studies should explore alternative COD tests that offer greater specificity and are tailored to the needs of the sport and its athletes. Such approaches will enhance the robustness and applicability of findings in understanding and evaluating performance in PBd.
Nevertheless, despite these limitations, our findings remain relevant. The study included a large and representative sample (n = 79) across sport classes, although sex-based analyses were not performed. While the COD test used was relatively simple, its ease of application makes it suitable for diverse training environments, an important factor considering the need for accessibility in this population. Future studies should explore different types of physical impairments with greater specificity, focusing on functional characteristics to better understand their impact on COD performance. Athletes, coaches, and classifiers should consider how physical factors may influence performance, and use this knowledge to optimize training within each sport class.
Practical implications
Our findings offer valuable insights for athletes and coaches aiming to improve performance in PBd. Understanding the influence of anthropometric characteristics, such as height, body mass and age, helps coaches design more personalized training strategies that boost movement efficiency and COD performance. For example, taller athletes can leverage their greater reach to reduce displacement time and enhance court coverage, while shorter athletes may benefit from training programs focused on agility, acceleration, and quick direction changes. Additionally, the positive link between length of experience and COD performance highlights the importance of long-term, structured training to develop the neuromuscular adaptations needed to overcome physical limitations. Consistent and targeted practice can be especially helpful in improving acceleration, deceleration and overall movement fluidity during gameplay. These insights support a more strategic and evidence-based approach to training in PBd, helping to optimize performance within each sport class.
CONCLUSIONS
Wheelchair use has a significant impact on COD performance, with WH1 and WH2 athletes showing lower results compared to other classes. This reinforces the need to consider functional limitations in performance analysis and training design. Our findings also indicate that body mass, height, and length of experience significantly influence COD indicators, regardless of sport class or type of physical impairment. Coaches and athletes should prioritize maintaining fitness and training intensity to improve COD performance. Such considerations should be applied universally, regardless of sport class and type of physical impairment.